Power BI
Overview
Fusion Signage's Power BI integration allows you to display live Power BI reports directly on your digital signage screens. This empowers you to share real-time data, dashboards, and insights with employees, customers, or stakeholders seamlessly through your displays.
Features:
Show live Power BI reports on your screens
Present real-time, up-to-date data
Schedule and tag reports for targeted display times
Manage reports within Fusion Signage like any other media item—add to playlists and publish easily
Pre-requisites
Fusion Signage PRO License
Minimum Application Versions:
Android: 2.6.2
Tizen: 2.4.1
WebOS: 2.3.5
BrightSign: 2.4.0
Windows: 2.4.0
If you need help updating your devices, contact support@fusionsignage.com.au.
Note: Publishing a report with an app version below the minimum will cause it to be ignored because it cannot render the report properly.
Important Setup Notes
The user establishing the Power BI connection must have appropriate permissions to access the Office 365 account.
Only one connection can be made between Fusion Signage and Office 365.
Reports accessible in Fusion Signage are limited to what the user who made the connection can access.
To manage data sharing effectively, consider creating a dedicated Microsoft user (e.g., signage-reports@yourcompany.com) with access to only the necessary reports.
Getting Started
Step 1: Connect Fusion Signage to Power BI
Log in to your Fusion Signage account.
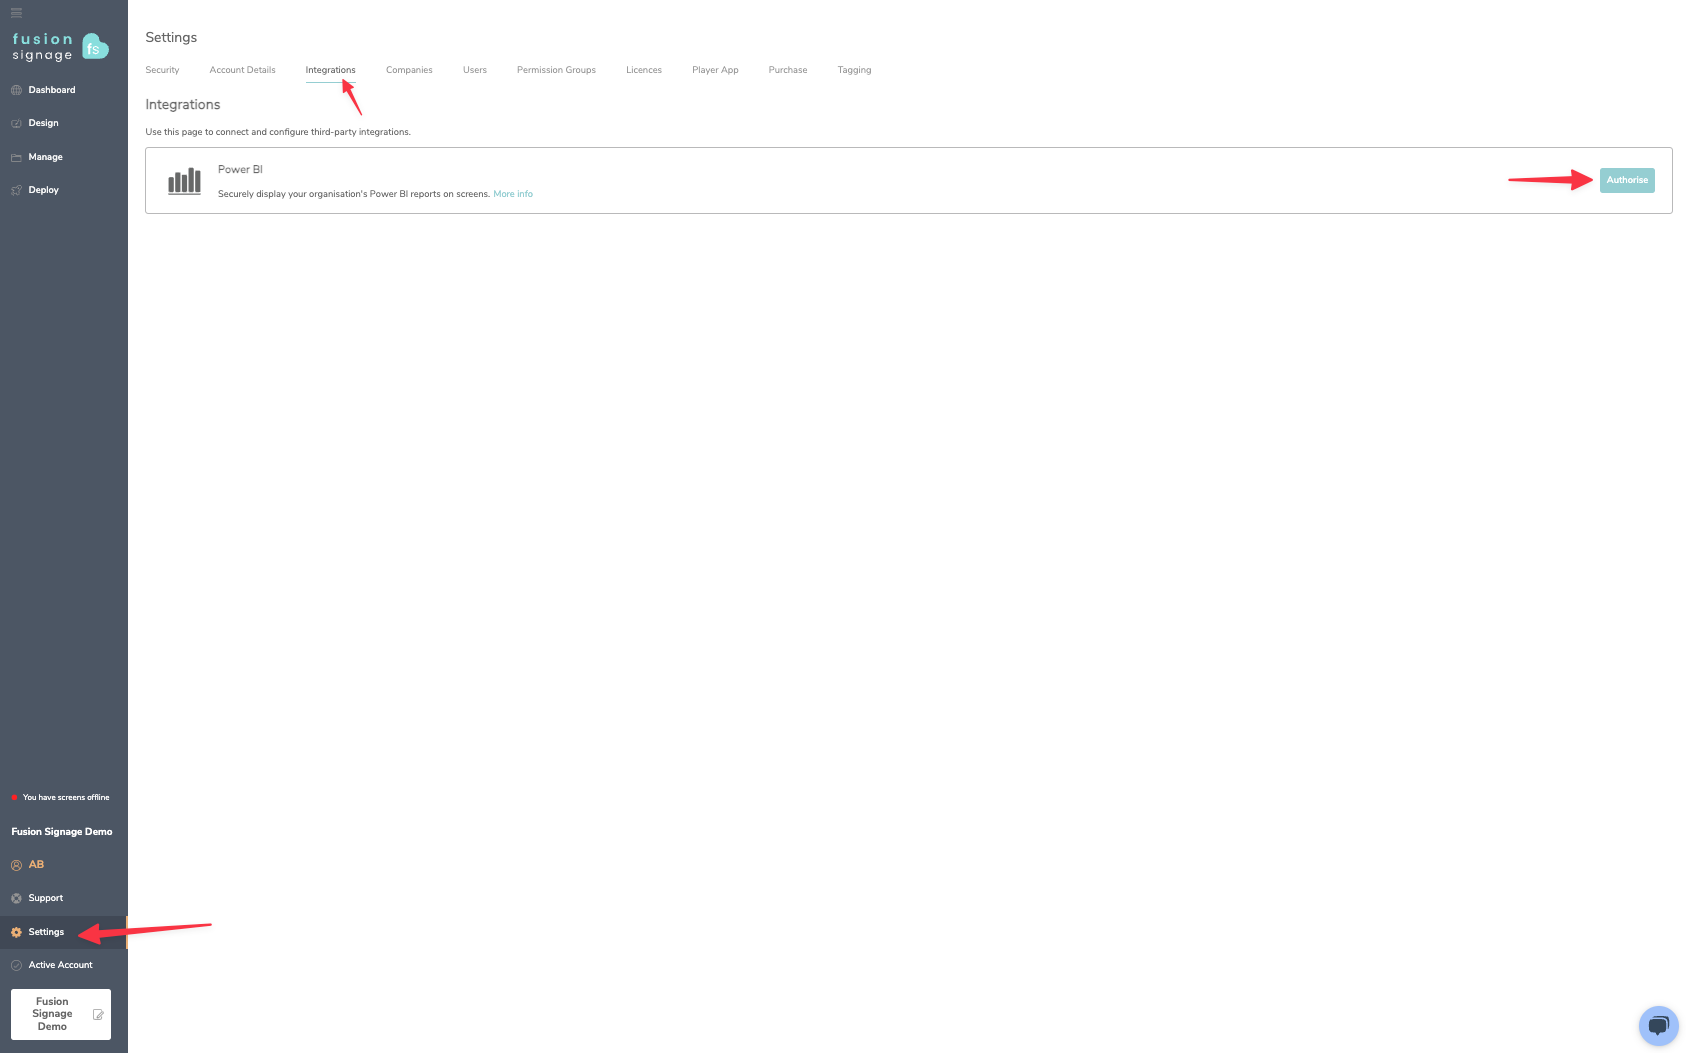
Go to Settings in the main menu.
Click on the Integrations tab, then select Power BI.
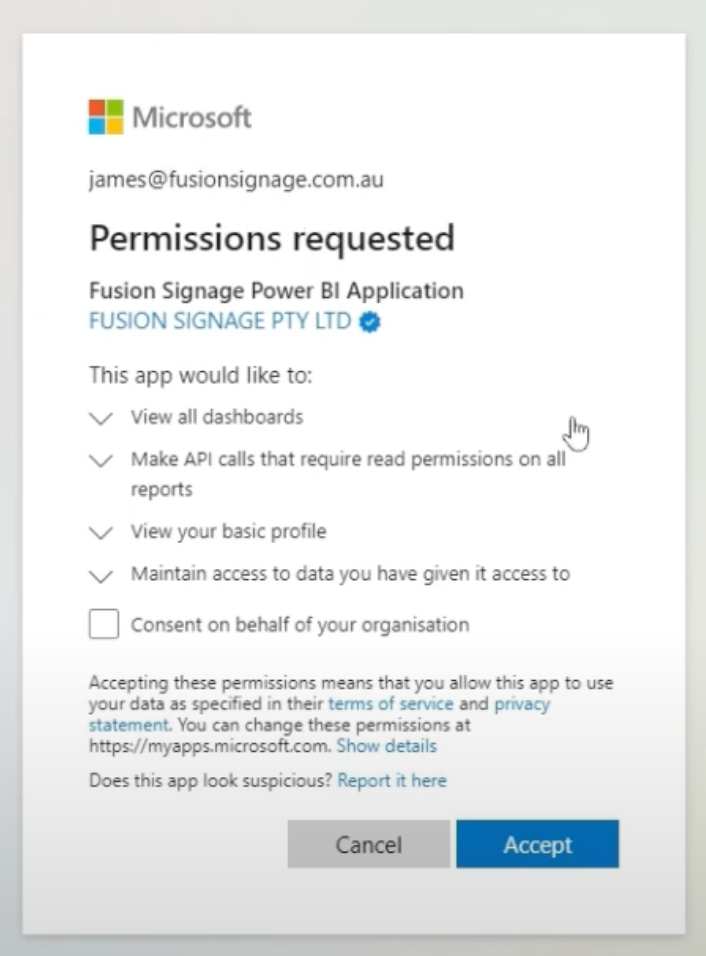
Click Authorise and follow the prompts to sign in to your Microsoft account.
Ensure the account has access to the reports you want to display.
Granting consent for your organisation will give Fusion Signage access to all reports—choose this carefully.
Step 2: Add Power BI Reports in Fusion Signage
Navigate to the Manage page.
Select or create a folder for your reports.
Click Add → Power BI.
Pick the desired report from the dropdown menu.
Select the specific report page to display (create new pages if needed).
Your report will now appear in your folder.
Step 3: Display Reports on Screens
Create a new playlist or edit an existing one.
Click Add → Media.
Select your Power BI report(s).
Set tagging or scheduling rules as needed.
Click Save & Publish to send the report to your screens.
Filtering Reports by Screen
To display relevant data on different screens:
Go to the Deploy page.
Select the Screen Name from your device list.
Click Configure Screen.
In the Power BI Filters section, click Add.
Choose the data filters applicable to that specific screen or region.
Add multiple filters as necessary.
Click Save to apply.
Removing the Power BI Integration
Go to Deploy → Integrations.
Click Delete next to the Power BI integration.
To fully remove access, your IT team can delete the app from Azure Active Directory:
Log in at Azure Portal.
Navigate to Microsoft Entra ID → Enterprise Applications.
Find and select Fusion Signage Power BI.
Under Manage → Properties, click Delete.
Using Power BI on a Brightsign device
On a Brightsign, live dashboarding isn’t enabled by default as they are running an older version of Chrome.
Make sure your device is running the latest version of the OS/Firmware, then follow these steps to update Chrome to 120 - https://docs.brightsign.biz/how-tos/upgrade-to-chromium-110120#mg_mb
Note - This is currently in Beta from Brightsign so please test this before going live